You know that the time you spend alive is your most valuable resource. But sometimes you put off important tasks and screw around doing more interesting stuff even though you know you shouldn't.
If that presumption is untrue, close this page. You're not going to benefit from this.
But if you can relate? You're about to understand yourself a little better.
If that presumption is untrue, close this page. You're not going to benefit from this.
But if you can relate? You're about to understand yourself a little better.
This article gives you a means for controlling your behaviour and prioritising tasks, by turning your emotions into numerical data you'll use to make logical decisions.
Let's start by acquiring the theoretical model.
Let's start by acquiring the theoretical model.
Theoretical Model of Distraction
Watch this smashing Concept Frontier InfoPod video. You'll learn how distraction works as a behaviour. That is, how your brain mishandles Interest and Importance so badly that you get distracted from important tasks.
This model explains the principle behind all Last Minute Work ever conducted by frantic human beings since our species first faced the need to work.
This model explains the principle behind all Last Minute Work ever conducted by frantic human beings since our species first faced the need to work.
Thanks for learning indeed!
Now scoot down for the practical lesson.
Now scoot down for the practical lesson.
The Practical Model
This is how to turn emotions into numerical data. Pretty snazzy stuff.
You'll also find it very easy to do and unbelievably effective.
Note that this is self-reported data, not empirical. And that's absolutely fine, since popping your living skull into an fMRI scanner is not a practical way to decide whether you should keep binge-watching The Walking Dead or tackle your overdue assignment.
It works by giving your logic-loving brain the actual numerical measurements it needs to make data-driven decisions.
Without them, logic is not going to be your primary decision-making force when determining behaviour; your brain would simply use the "default mode" of relying solely on your on-the-fly interpretation of your feelings to determine the priority order of your tasks.
And if you've ever started and completed a huge assignment the night before it was due, then you know just how ugly that can get.
Strong coffee isn't enough. You need a psychological edge.
This is it.
Objectives
- Produce numerical data for Interest and Importance level per task.
- Use that data to prioritise tasks logically.
Method
Grab a pen and paper and let's chart your brain's contents.
1. Specify your tasks
Right after you're done here, there's a bunch of stuff you feel compelled to do.
In this article I'll use two example tasks: writing an article OR watch a film.
For your copy, pick any two (or more) task activities of your own. They can be in the same quadrant or different ones. Just make sure you choose tasks you can clearly specify like "work on my thesis" or "play Assassin's Creed". The more specific you position them, the more specific your results will be.
2. Draw a grid
3x3 like this:
3. Rate the Importance and Interest of the first task on a 1-10 scale
In your grid, rate on a scale of 1 to 10 the Importance and Interest of each task.
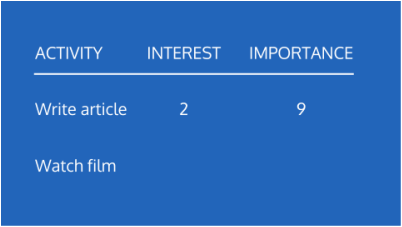
Start with the Important task, the work. Maybe it's dreadfully boring so interest is low, let’s say 2.
But it’s quite Important you get paid for it (or don't get your head kicked in by your teacher/lecturer/employer), so importance is a 9.
3. Rate the Importance and Interest of other tasks on a 1-10 scale
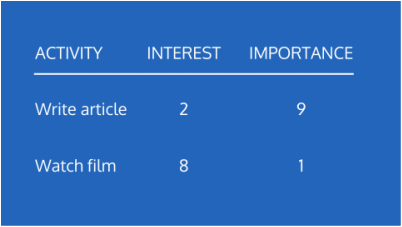
In this example watching a film is pretty interesting, let's say 8. But it's not really important. 1 out of 10 there. Do this for all the tasks you want to compare.
In this example watching a film is pretty interesting, let's say 8. But it's not really important. 1 out of 10 there. Do this for all the tasks you want to compare.
It's vital you are honest with yourself about the level of interest and importance for each task.
Now you have data. Simple, self-reported data, but data nonetheless.
That was easy, and you could've thought it up yourself! But you didn't. (You're getting it for even less cognitive effort — nice!)
Now you need to use your data table to get a result. In this case, the result will be a priority decision for your tasks.
4. Evaluate your data
In this next part there's an element of trial and error to find what works best for you. And a bit of creativity needed on your part to get it perfect.
But for now we'll use a "default scoring" of simple row addition as a starting point. Don't worry! The decisions you get this way are still going to make your decisions a hell of a lot more logical than they were before you fed your brain's starving logic appetite with delicious raw numbers.
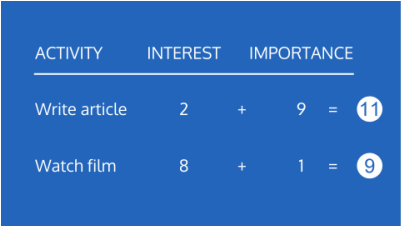
Scoring can be as complicated as you like. This one, offered as a default, just has you add the value from the Interest and Importance columns to give the priority score for that task.
In this case, the work has a score of 11, but watching the film only has a score of 9. The default scoring rule is that the activity with the higher score is the one you do first. Logical, right?
What about complexity?
Are you evaluating big, time-consuming tasks? You can evaluate the same tasks again in a few hours, days, once you've completed them in full or in part. You'll see if and how the Interest and Importance levels change for each task.
If you're someone who values consistency for consistency's sake, apart from being the type of person to absolutely crucify people whenever they change their mind, you may find there's absolute consistency in your Interest and Importance levels of every task.
Interest and importance are supposed to change. Just try and produce data based on how you honestly feel in the moment, and embrace the inherent fluidity of your adaptive human feelings.
The more data you produce (even just as an exercise when you don't need help making a decision), the more insight you will gain into your Interest habits and Importance evaluations. If you record the date and time of each assessment, you will even be able to identify your own behavioural patterns over time. Extremely cool if you're into quantifying yourself!
Are you procrastinating on something important? If you are, give this system a try! Experience turning your feelings on your dreaded Quadrant 3 task (and whatever Quadrant 2 task you're using to indulge your interest!) into a data-driven decision.
Bonus Concept:
In the course of developing this model, producing the video, article, and the system I experienced a delay of FOUR EARTH MONTHS due to distraction.
Making this article and the associated video were Quadrant 1 tasks: Both VERY Important to me, and Interesting to me.
But the distraction I experienced was another Quadrant 1 task with high importance and high interest! It was a project for a client. So even though the importance and interest of producing this content were super high, the external project took precedence because the reliance of my client meant I ranked it slightly higher on the importance scale over that four month period.
This stands as an example of two tasks both in Quadrant 1 (the BEST QUADRANT that is, with high IMPORTANCE and high INTEREST) being evaluated in this very system described above. Meta!
The data for these projects were:
Client project: Imp:10, Int:9
Concept Frontier project: Imp: 9, Int:9
Thanks for learning!
Now go make some excellent decisions, and remember to spend as much time as you can in Quadrant 1.
Michael


 RSS Feed
